MAIN PUBLICATION :
| Home � TECHNOLOGY � Small Wind Turbines � Technology status |

|
Technology Status
A review of the technology status is given here, arranged by components. A colour code has been used to show the popularity of various technical options for all cases that have been analysed and for which there was information available. The colour code shows the estimated frequency of occurrence of each option, as a percentage (see Table 6.3).
Table 6.3: Colour Code for Estimated Frequency of Occurrence of Technical Options
0 0-25 25-50 50-75 75-100
This analysis has been made for each of the SWT power ranges defined in Table 6.1.
ROTOR
The rotor technology status is summarised in Table 6.4:
Table 6.4: Rotor and Related Issues
The results for the analyses of the generator and the power electronics used in SWTs are summarised in Table 6.5. Brief comments have been included for the different sizes of SWT.
Table 6.5: Generator, Power Electronics and Other Comments


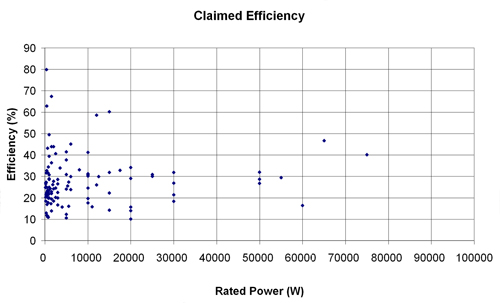
CLAIMED EFFICIENCY
Another aspect in which SWTs are different to large grid-connected wind turbines is the generation efficiency. Firstly, the efficiency for SWTs is not well known, as there is not much information available; second, the values are usually significantly lower than those for large wind turbines. Aerodynamics has something to do with this, but principally, designs for SWTs are not optimised. Figure 6.1 shows a graph of manufacturers’ claimed efficiencies for SWT as a function of rated power at rated wind speed.
It should be noted that IEC standards for power curve measurement are not as rigorously applied by SWT manufacturers as they are in the large wind turbine field, and so comparison is difficult (see Appendix E for further details).
Figure 6.1: Claimed Efficiency as a Function of Rated Power
Omitting the models that appear to break the fundamental Betz limit, some comments can be made:
- In general, the efficiency for SWT generation is lower than for large wind turbines (as previously noted, this is in part due to aerodynamics but also due to the lack of optimised designs); and
- In reality, the actual efficiencies tend to be even lower (values between 10 and 25 per cent are common).
COST ANALYSIS
It is common to use the cost per kilowatt for the analysis cost of different generating technologies. For the case of SWTs, the picture obtained is as in Figure 6.2.
Figure 6.2: Cost per kW as a Function of Rated Power
Values are greatly scattered for the low power range, but the trend is that cost per kW diminishes as the rated power increases.
However, an overall cost analysis for SWTs must be preceded by a comment on the definition of the rated power of an SWT. In wind energy generation, there are no universally-accepted standard test conditions (STC is the term used for photovoltaic generation) to which all of the characterisations of the devices are referred. So, it is the manufacturer who chooses the conditions (rated wind speed) for which to define the rated power of the SWT. The situation is clarified to some extent in the Figure 6.3, where the chosen rated wind speeds are shown for the different rated power values of the SWT under study.
Figure 6.3: Comparison of Manufacturers’ Defined Rated Wind Speed and Rated Power
The large variation in the rated wind speed value means that the specific parameters related to rated power cannot be compared directly, as they do not refer to the same conditions. For large wind turbines there are no defined standard conditions either, but the higher maturity of the market has led to a much lower dispersion.
Another parameter, which is objective, and not subjective like rated power, is the swept rotor area. Figure 6.4 shows the variation of power rating as a function of the diameter.
Figure 6.4: Manufacturers’ Defined Rated Power as a Function of Rotor Diameter
Even though for higher diameters some dispersion appears, the swept rotor area seems to be a better representation of the power of the SWT than the rated power itself, and it is definitively more representative of the total energy generated by the SWT. That is also the reason for using the cost per square metre, as shown in Figure 6.5, for the cost analysis.
Figure 6.5: Cost per m2 as a Function of Rated Power
Even though there is still a significant scattering in the low power range, which is a sign of lack of maturity of the market, the trend of lower costs per square metre is maintained as the size of the SWT increases, which is an advantage when compared with PV generation, a direct competitor of SWTs.


| << Technology trends and recent developments | Future trends >> |
| Acknowledgements | Sitemap | Partners | Disclaimer | Contact | ||
|
coordinated by |
supported by  |
The sole responsibility for the content of this webpage lies with the authors. It does not necessarily reflect the opinion of the European Communities. The European Commission is not responsible for any use that maybe made of the information contained therein. |
