MAIN PUBLICATION :
| Home � TECHNOLOGY � Wind resource estimation � Local wind resource assessment and energy analysis � The annual variability of wind speed |

|
The Annual Variability of Wind Speed
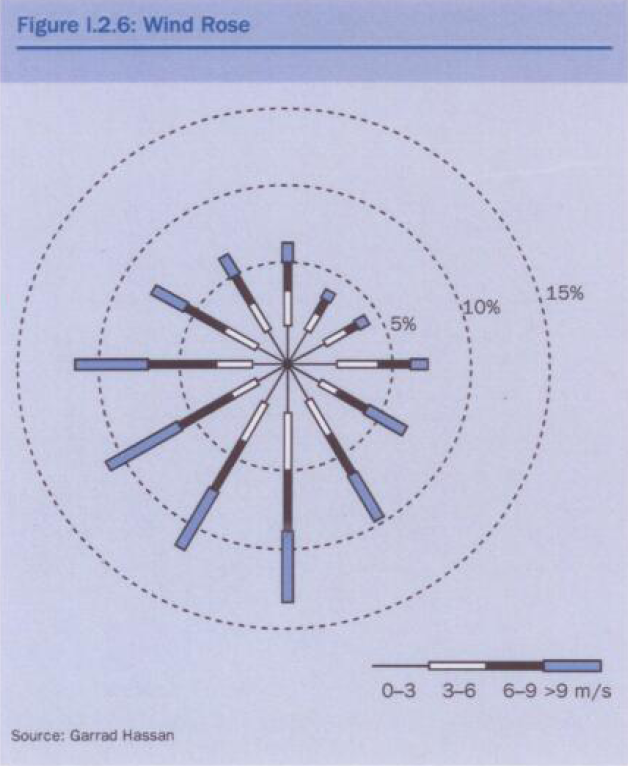
A ‘wind rose’ is the term given to the way in which the joint wind speed and direction distribution is defined. An example is given in Figure I.2.6. The wind rose can be thought of as a wheel with spokes, spaced, in this example, at 30 degrees. For each sector, the wind is considered separately. The duration for which the wind comes from this sector is shown by the length of the spoke and the speed is shown by the thickness of the spoke. The design of a wind farm is sensitive to the shape of the wind rose for the site. In some areas, particularly in areas where the wind is driven by thermal effects, the wind can be very unidirectional. For example, in Palm Springs in the US, the wind comes from a sector 10 degrees wide, for 95 per cent of the year. In this type of site, the wind farms tend to be arranged in tightly packed rows, perpendicular to the wind, with large spaces downwind. In Northern Europe, the wind, although predominantly from the southwest, also comes from other directions for a significant amount of time, and hence wind turbines tend to be more uniformly spaced in all directions.
Figure I.2.6: Wind Rose
Source: Garrad Hassan
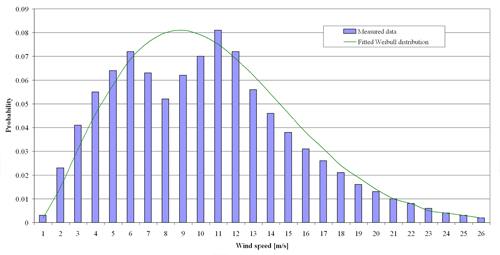
The description above focused on the wind speed and wind rose. The other important parameter determining the output of a wind farm is the wind speed distribution. This distribution describes the amount of time on a particular site that the wind speed is between different levels. This characteristic can be very important, but is often inadequately treated. This distribution is important since it is the combination of the wind speed distribution and the power curve of the proposed turbine which together determine the energy production.
Consider, as an example, two sites, A and B. At one extreme, at Site A, the wind blows at 9 m/s permanently and the wind farm would be very energetic. At the other extreme, at Site B, let us assume that the wind blows at 4 m/s (below cut-in wind speed for a typical wind turbine) for one third of the time, at 26m/s (above cut-out wind speed for most turbines) for one third of the time and at 9m/s for one third of the time. The mean wind speed would then be (1/3) x (4 + 9 + 26) = 13m/s, much higher than Site A, but the energy yield at Site B would be only a third of that at Site A.
These two examples are both unrealistic, but serve to illustrate a point – that wind speed alone is not enough to describe the potential energy from the site. Some more realistic site wind speed distributions are shown in Figure I.2.7. In this figure, the actual wind speed distribution is shown, as well as a ‘Weibull fit’ to the distribution. The Weibull distribution is a mathematical expression, which provides a good approximation to many measured wind speed distributions. The Weibull distribution is therefore frequently used to characterise a site. Such a distribution is described by two parameters: the Weibull ‘scale,’ parameter which is closely related to the mean wind speed, and the ‘shape’ parameter, which is a measurement of the width of the distribution. This approach is useful since it allows both the wind speed and its distribution to be described in a concise fashion. However, as can be seen from the figure, care must be taken in using a Weibull fit. For many sites it may provide a good likeness to the actual wind speed distribution, but there are some sites where differences may be significant.
Figure I.2.7: Examples of Wind Speed Distributions
Source: Garrad Hassan
The annual variability in wind rose and wind speed frequency distribution is also important in assessing the uncertainty in the annual energy production of a wind farm, and is described in detail in the sections below.
For the purpose of the example, only the variation in annual mean wind speed is considered, as the other factors usually have a secondary effect.

VARIABILITY OF ONE-YEAR PERIODS
As discussed above, the annual variability of wind speed has a strong influence on the analysis methodologies developed for the assessment of the long-term wind resource at a site and the uncertainty in such predictions. Before describing typical methodologies used for the prediction of the long-term mean wind speed at a site, an example is used to illustrate typical levels of annual variability of wind speed. The example presented below seeks to answer the following questions:
- If there is one year of wind data available from a potential wind farm site, what error is likely to be associated with assuming that such data is representative of the long term?
- If, instead, there are three years of data available from the site how does the picture change?
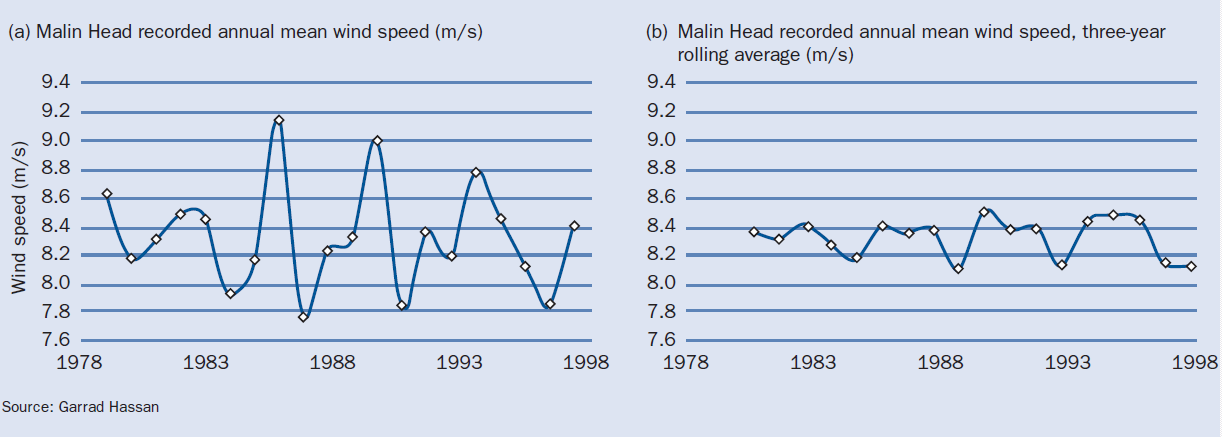
Figure I.2.8(a) presents the annual mean wind speed recorded at Malin Head Meteorological Station in Ireland, over a 20 year period. It can be seen that there is significant variation in the annual mean wind speed, with maximum and minimum values ranging from less than 7.8 m/s to nearly 9.2 m/s. The standard deviation of annual mean wind speed over the 20 year period is approximately 5 per cent of the mean.
Figure I.2.8: (a) The Annual Mean Wind Speed Recorded at Malin Head Ireland; (b) Annual Mean Wind Speed at Malin Head over a 20 Year Period - Three Year Rolling Averages
Source: Garrad Hassan
Table I.2.3 presents the average and annual maximum and minimum wind speeds. As an illustration, the equivalent annual energy productions for the example 10 MW wind farm case described earlier, are also presented in the table.
Table I.2.3: Wind Speeds and Energy Production for the Average, Lowest and Highest Wind Speed Year in the Period 1979 to 1998, Based on a Nominal 10 MW Wind Farm at Malin Head
Annual mean wind speed (m/s) Percentage of average year
(percent)
Energy production (MWh/annum) Percentage of average year
(percent)
Lowest wind speed year (1987) 7.77 93.3 29,491 89.8 Average year 8.33 100.0 32,847 100.0 Highest wind speed year (1986) 9.16 110.0 37,413 113.9
Table I.2.3 shows that, had wind speed measurements been carried out on the site for just one year, on the assumption that this year would be representative of the long term, then the predicted long-term wind speed at the site could have had a 10 per cent margin of error. It is often the case that little on-site data is available and hence this situation can arise. In terms of energy production, it is evident that the predicted energy production could be in error by some 14 per cent, if the above assumption had been made. For a lower wind speed site, a 10 per cent error in wind speed could easily have a 20 per cent effect on energy production, owing to the higher sensitivity of energy production to changes in wind speed at lower wind speeds.
VARIABILITY OF THREE-YEAR PERIODS
Figure I.2.8(b) illustrates the same data as presented in Figure I.2.8(a) above, but in this instance, a three-year rolling average of the data has been taken. It is immediately apparent that the variability in the mean wind speed over three-year periods is substantially reduced compared with that of one-year periods.
The results presented in Table I.2.3 are reproduced in Table I.2.4, this time based on the highest and lowest three-year averages.
Table I.2.4: Wind speeds and energy production for the average, lowest and highest three year periods within the period 1979 to 1998
Annual mean wind speed (m/s) Percentage of average year
(percent)
Energy production (MWh/annum) Percentage of average year
(percent)
Lowest wind speed year (1989) 8.10 97.2 31,540 96.0 Average year 8.33 100.0 32,847 100.0 Highest wind speed year (1990) 8.51 102.2 33,871 103.1
Table I.2.4 illustrates that, if three years worth of data are available from a site, the maximum deviations in wind speed and energy production over these periods, from long-term averages, is substantially reduced. The deviations of 10 per cent and 14 per cent in wind speed and energy, for the analysis based on one-year data sets, reduces to deviations of 3 per cent and 4 per cent respectively when three-year periods are considered.
While the results presented here are site-specific, they are broadly representative of any wind farm in Europe. The reliability of long-term data and the consistency of the wind is a matter that is central to the commercial appraisal of a wind farm. Substantial work has been undertaken to try and identify some key characteristics of the long-term behaviour of wind. This effort consisted of the identification of reliable long-term data sets around the world and attempting to identify common characteristics. One of the results of this approach is illustrated in Figure I.2.9. Data sets of around 30 years in duration have been assembled, and for each site the mean of the 30 annual figures was calculated, together with their standard deviation. The ratio of the standard deviation to the mean was then calculated and it was found that the ratio varied very little from location to location. This feature was observed in many areas across the world – data was collected from Australia, Japan and the US, as well as in Europe. This result is useful in determining how much variation in wind is to be expected.
Figure I.2.9: Wind Map of Europe– Inter annual variations. Shown as Standard Deviation as a percentage of mean
Source: Garrad Hassan
In summary, this work indicated that the annual variability of long-term mean wind speeds at sites across Europe tends to be similar, and can reasonably be characterised as having a normal distribution with a standard deviation of 6 per cent. This result plays an important role in the assessment of the uncertainty in the prediction of wind farm energy production.

| << Best practice for accurate wind speed measurements | Analytical methods for the prediction of the long-term wind regime at a site >> |
| Acknowledgements | Sitemap | Partners | Disclaimer | Contact | ||
|
coordinated by |
supported by  |
The sole responsibility for the content of this webpage lies with the authors. It does not necessarily reflect the opinion of the European Communities. The European Commission is not responsible for any use that maybe made of the information contained therein. |
