MAIN PUBLICATION :
| Home � ECONOMICS � Cost of on-land wind power � Cost and investment structures |

|
Investment costs
The capital costs of wind energy projects are dominated by the cost of the wind turbine itself (ex works) . Table 1.1 shows the typical cost structure for a 2 MW turbine erected in Europe. An average turbine installed in Europe has a total investment cost of around €1.23 million/MW. The turbine’s share of the total cost is, on average, around 76 per cent, while grid connection accounts for around 9 per cent and foundations for around 7 per cent. The cost of acquiring a turbine site (on land) varies significantly between projects, so the figures in Table 1.1 are only to be taken as examples. Other cost components, such as control systems and land, account for only a minor share of total costs.
Table 1.1: Cost Structure of a Typical 2 MW Wind Turbine Installed in Europe (year 2006 €)
Investment(€1,000/MW) Share(per cent) Turbine(ex works) 928 75.6 Foundation 80 6.5 Electric installation 18 1.5 Grid connection 109 8.9 Control systems 4 0.3 Consultancy 15 1.2 Land 48 3.9 Financial costs 15 1.2 Road 11 0.9 Total 1,227 100 Source: Calculations by the author based on selected data for European wind turbine installations
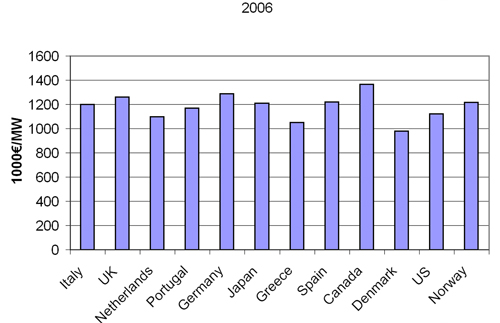
The total cost per kW of installed wind power capacity differs significantly between countries, as shown in Figure 1.1. The cost per kW typically varies from around €1,000/kW to €1,350/kW. As shown in Figure 1.1, the investment costs per kW were found to be lowest in Denmark, and slightly higher in Greece and the Netherlands. For the UK, Spain and Germany, the costs in the data selection were found to be around 20-30 per cent higher than in Denmark. However, it should be observed that Figure 1.1 is based on limited data, so the results might not be entirely representative for the countries involved.
Figure 1.1: Total Investment Cost, Including Turbine, Foundation and Grid Connection, Shown for Different Turbine Sizes and Countries of Installation
Source: Based on data from the IEA
Also, for 'other costs', such as foundation and grid connection, there is considerable variation between countries, ranging from around 32 per cent of total turbine costs in Portugal to 24 per cent in Germany, 21 per cent in Italy and only 16 per cent in Denmark. However, costs vary depending on turbine size, as well as the country of installation.
The typical ranges of these other cost components as a share of total additional costs are shown in Table 1.2. In terms of variation, the single most important additional component is the cost of grid connection which, in some cases, can account for almost half of the auxiliary costs, followed by typically lower shares for foundation cost and cost of the electrical installation. Thus these auxiliary costs may add significant amounts to the total cost of the turbine. Cost components such as consultancy and land usually only account for a minor share of the additional costs.
Table 1.2: Cost Structure for a Medium-Sized Wind Turbine
Share of total cost Typical share of other costs (per cent) Turbine (ex works) 68-84 n/a Foundation 1-9 20-25 Electric installation 1-9 10-15 Grid connection 2-10 35-45 Consultancy 1-3 5-10 Land 1-5 5-10 Financial costs 1-5 5-10 Road construction 1-5 5-10 Source: Based on a limited data selection from Germany, Denmark, Spain and the UK adjusted and updated by the author
For a number of selected countries, the turbine and auxiliary costs (foundation and grid connection) are shown in Figure 1.2.
Figure 1.2: Price of Turbine and Additional Costs for Foundation and Grid Connection, Calculated per kW for Selected Countries (Left Axis), Including Turbine Share of Total Costs (Right Axis.).
Note: The result for Japan may be caused by a different split of turbine investment costs and other costs, as the total adds up to almost the same level as seen for the other countries.
Source: Risø
, including turbine share of total costs (right axes.). Source: Risoe. Note: The different result for Japan may be caused by another split by turbine investment costs and other costs, as the total adds up to almost the same level as seen for the other countries.")
| Acknowledgements | Sitemap | Partners | Disclaimer | Contact | ||
|
coordinated by |
supported by  |
The sole responsibility for the content of this webpage lies with the authors. It does not necessarily reflect the opinion of the European Communities. The European Commission is not responsible for any use that maybe made of the information contained therein. |
