MAIN PUBLICATION :
| Home � ECONOMICS � Offshore developments |

|
CHAPTER 2: OFFSHORE DEVELOPMENTS
Development and Investment Costs of Offshore Wind Power
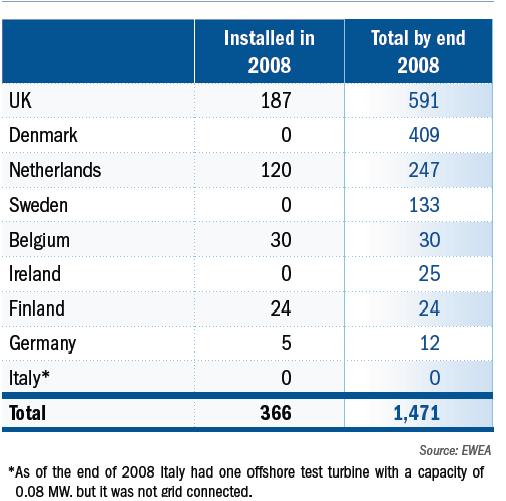
Offshore wind only accounts for a small amount of the total installed wind power capacity in the world – approximately 1 per cent. The development of offshore wind has mainly been in northern European counties, around the North Sea and the Baltic Sea, where about 20 projects have been implemented. At the end of 2007, almost 1 100 MW of capacity was located offshore. 2008 saw 366 MW of offshore wind capacity installed in the EU, taking the total installed capacity to 1 471 MW in nine Member States, compared to the five countries having operating wind farms in 2007.
Offshore wind power in Europe 2008
Source: EWEA
Figure 2.1: Development of Offshore Wind Power in the EU, 1998-2007
Source: EWEA
Figure 2.2: Total Offshore Wind Power Installed by the End of 2007
Source: EWEA
Five countries have operating offshore wind farms: Denmark, Ireland, The Netherlands, Sweden and the UK, as shown in Table 2.1. In 2007, the Swedish offshore wind farm, Lillgrunden, with a rated capacity of 110 MW was installed. Most of the capacity has been installed in relatively shallow waters (under 20m deep) no more than 20km from the coast, in order to minimise the extra costs of foundations and sea cables.
Table 2.1: Installed Offshore Capacity in Offshore Wind Countries.
Country MW installed in 2006 Accumulated MW, end 2006 MW installed in 2007 Accumulated MW, end 2007 Denmark 0 409 0 409 Ireland 0 25 0 25 The Netherlands 108 108 0 108 Sweden 0 23 110 133 UK 90 304 100 404 Total global 198 869 210 1079 Source: EWEA
Offshore wind is still around 50 per cent more expensive than onshore wind. However, due to the expected benefits of more wind and the lower visual impact of the larger turbines, several countries now have very ambitious goals concerning offshore wind.
The total capacity is still limited, but growth rates are high. Offshore wind farms are installed in large units - often 100-200 MW - and two new installed wind farms per year will result in future growth rates of between 20 and 40 per cent. Presently, higher costs and temporary capacity problems in the manufacturing stages, as well as in the availability of installation vessels, cause some delays, but even so, several projects in the UK and Denmark will be finished within the next three years, as seen in Tables 2.2-2.6.
Table 2.2: Operating and Planned Offshore Wind Farms in the UK.
Project Location Region Capacity Nr of turbines Water Depth Distance To Shore Online In operation Barrow 7km WalneyIsland Off England 90 30 >15 7km 2006 Beatrice Beatrice Oilfield,Moray Firth Off Scotland 10 2 >40 unknown 2007 Blyth Offshore 1km BlythHarbour Off England 3,8 2 6 1km 2000 Burbo Bank 5.2km Crosby Off England 90 25 10 5.2km 2007 Kentish Flats 8.5 km offshore from Whitstable Off England 90 30 5 8.5km 2005 North Hoyle 7.5km Prestatyn & Rhyl Off Wales/England 60 30 5 to 12 7.5km 2003 Scroby Sands 3km NE GreatYarmouth Off England 60 30 2 to 10 3km 2004 403.8 Under Construction Inner Dowsing 5.2km Ingoldmells Off England 90 27 10 5.2km n.c. Lynn 5.2km Skegness Off England 97 30 5.2km n.c. Ryhl Flats 8km Abergele Off Wales 90 25 8 8km n.c. Solway Firth/Robin Rigg A 9.5km Maryport/8.5km off Rock Cliffe Off England/Scotland 90 30 >5 9.5km n.c. Solway Firth/Robin Rigg B 9.5km Maryport/8.5km off Rock Cliffe Off England/Scotland 90 30 >5 9.5km n.c. Source: EWEA
Table 2.3: Operating and Planned Offshore Wind Farms in The Netherlands
Project Location Capacity Nr of turbines Water Depth Distance To Shore Online In operation Offshore Wind Farm Egmond aan Zee (OWEZ) Egmond aan Zee 108 36 17-23 m 8 - 12 km 2006 Lely* Medemblik, Ijsselmeer (inland lake) 2 4 7.5 0.75 1994 Irene Vorrink (Dronten)* Dronten, Ijsselmeer (inland freshwater lake), to the outside of the dyke 16,8 28 2 0.03 1996 Princess Amalia Ijmuiden 120 60 19 - 24 m > 23 km 2008 Source: EWEA
Table 2.4: Operating and Planned Offshore Wind Farms in Denmark
Project Location Capacity Number
of turbinesWater Depth Distance To Shore Online Operation Vindeby Blæsenborg Odde, NW off Vindeby, Lolland 4,95 11 2.5 to 5 2.5 1991 Tunø Knob off Aarhus, Kattegat Sea 5 10 0.8 to 4 6 1995 Middelgrunden Oresund, east of Copenhagen harbour 40 20 5 to 10 2 to 3 2001 Horns Rev Blåvandshuk, Baltic Sea 160 80 6 to 14 14-20 2002 Nysted Havmøllepark Rødsand, Lolland 165,6 72 6 to 9 6 2003 Samsø Paludans Flak, South of Samsø 23 4 11 to 18 3,5 2003 Frederikshavn£ Frederikshavn Harbour 10,6 3 0.8 2003 Rønland* Lim fjord, off Rønland peninsula, in the Nissum Bredning , off NW Jutland 17,2 8 3 2003 * near shore projects 409,15 Construction Horns Rev II Blåvandshuk, Baltic Sea (10km west of Horns Rev) 200 10 to 18 n.c. 17 2009 Nysted Havmøllepark II 9km off Rødsand, Lolland in the Baltic Sea 200 6 to 9 n.c. 10 2010 Source: EWEA
Table 2. 5: Operating and Planned Offshore Wind Farms in Sweden
Operational Project Location Capacity Number
of turbinesWater Depth Distance To Shore Online Bockstigen Gotland 2,8 5 6 - 8 m 3 km 1998 Utgrunden I Kalmarsund 10,5 7 4 - 10 m 7 km 2001 Yttre Stengrund Kalmarsund 10,0 5 8 - 12 m 4 km 2002 Lillgrund Malmö 110,0 48 2,5 - 9 m 10 km 2007 133,25 Under construction Gässlingegrund Vänern 30 10 4-10 m 4 km 2009 Source: EWEA
Table 2.6: Operating and Planned Offshore Wind Farms in Ireland
Project Location Capacity Number
of turbinesWater Depth Distance To Shore Online Arklow Bank off Arklow, Co Wicklow 25.2 7 15 7 2004 Source: EWEA
Offshore costs depend largely on weather and wave conditions, water depth and distance from the coast. The most detailed cost information on recent offshore installations comes from the UK, where 90 MW in 2006 and 100 MW in 2007 were added, and from Sweden with the installation of Lillgrunden in 2007.
Table 2.7 gives information on some of the recently established offshore wind farms. As shown, the chosen turbine size for offshore wind farms ranges from 2 to 3.6 MW, with the newer wind farms being equipped with the larger turbines. The size of the wind farms also vary substantially, from the fairly small Samsø wind farm of 23 MW, to Robin Rigg, the world’s largest offshore wind farm, with a rated capacity of 180 MW. Investment costs per MW range from a low of 1.2 million €/MW (Middelgrunden) to 2.7 million €/MW (Robin Rigg) - see Figure 2.3.
Table 2.7: Key Information on Recent Offshore Wind Farms
In operation Number
of turbinesTurbine size Capacity MW Investment costs
€ millionMiddelgrunden (DK) 2001 20 2 40 47 Horns Rev I (DK) 2002 80 2 160 272 Samsø (DK) 2003 10 2.3 23 30 North Hoyle (UK) 2003 30 2 60 121 Nysted (DK) 2004 72 2.3 165 248 Scroby Sands (UK) 2004 30 2 60 121 Kentich Flats (UK) 2005 30 3 90 159 Barrows (UK) 2006 30 3 90 - Burbo Bank (UK) 2007 24 3.6 90 181 Lillgrunden (S) 2007 48 2.3 110 197 Robin Rigg (UK) 2008 60 3 180 492 Note: Robin Rigg is planned to be in operation in 2008
Source: Risø DTU
The higher offshore capital costs are due to the larger structures and complex logistics of installing the towers. The costs of offshore foundations, construction, installations and grid connection are significantly higher than for onshore. For example, offshore turbines are generally 20 per cent more expensive and towers and foundations cost more than 2.5 times the price of those for a similar onshore project.
Figure 2.3: Investments in Offshore Wind Farms, Million €/MW (Current Prices)
Source: Risø DTU
In general, the costs of offshore capacity have increased in recent years, as is the case for land-based turbines, and these increases are only partly reflected in the costs shown in Figure 2.3. As a result, the average costs of future offshore farms are expected to be higher. On average, investment costs for a new offshore wind farm are expected be in the range of 2.0 to 2.2 million €/MW for a near-shore, shallow-water facility.
To illustrate the economics of offshore wind turbines in more detail, the two largest Danish offshore wind farms can be taken as examples. The Horns Rev project, located approximately 15 km off the west coast of Jutland (west of Esbjerg), was finished in 2002. It is equipped with 80 machines of 2 MW, with a total capacity of 160 MW. The Nysted offshore wind farm is located south of the isle of Lolland. It consists of 72 turbines of 2.3 MW and has a total capacity of 165 MW. Both wind farms have their own on-site transformer stations, which are connected to the high voltage grid at the coast via transmission cables. The farms are operated from onshore control stations, so staff are not required at the sites. The average investment costs related to these two farms are shown in Table 2.8
Table 2.8: Average Investment Costs per MW Related to Offshore Wind Farms in Horns Rev and Nysted
Investments 1000 €/MW Share (per cent) Turbines ex works, including transport and erection 815 49 Transformer station and main cable to coast 270 16 Internal grid between turbines 85 5 Foundations 350 21 Design and project management 100 6 Environmental analysis 50 3 Miscellaneous 10 <1 Total 1,680 ~100 Note: Exchange rate EUR1 = DKK7.45
Source: Risø DTU
In Denmark, all of the cost components above are covered by the investors, except for the costs of the transformer station and the main transmission cable to the coast, which are covered by TSOs in the respective areas. The total costs of each of the two offshore farms are around €260 million.
In comparison to land-based turbines, the main differences in the cost structure are related to two issues:
- Foundations are considerably more expensive for offshore turbines. The costs depend on both the sea depth and the type of foundation being built (at Horns Rev monopiles were used, while the turbines at Nysted are erected on concrete gravity foundations). For a conventional turbine situated on land, the foundations’ share of the total cost is normally around 5-9 per cent, while the average of the two projects mentioned above is 21 per cent (see Table 2.8), and thus considerably more expensive. However, since considerable experience will be gained through these two wind farms, a further optimisation of foundations can be expected in future projects.
- Transformer stations and sea transmission cables increase costs. Connections between turbines and the centrally located transformer station, and from there to the coast, generate additional costs. For the Horns Rev and Nysted wind farms, the average cost share for the transformer station and sea transmission cables is 21 per cent (see Table 2.8), of which a small proportion (5 per cent) goes on the internal grid between turbines.
Finally, a number of environmental analyses, including an environmental impact investigation (EIA) and graphic visualising of the wind farms, as well as additional research and development were carried out. The average cost share for these analyses accounts for approximately 6 per cent of total costs, but part of these costs are related to the pilot character of these projects and are not expected to be repeated for future offshore wind farm installations.


, source: Risoe")
| Acknowledgements | Sitemap | Partners | Disclaimer | Contact | ||
|
coordinated by |
supported by  |
The sole responsibility for the content of this webpage lies with the authors. It does not necessarily reflect the opinion of the European Communities. The European Commission is not responsible for any use that maybe made of the information contained therein. |
