MAIN PUBLICATION :
| Home � ECONOMICS � Wind Power at the Spot Market � The Impact of Wind Power on the Power Market: DK Case |

|
The Impact of Wind Power on the Power Market – Illustrated by the Case of Denmark
Denmark has a total capacity of a little more than 3,200 MW of wind power - approximately 2,800 MW from land turbines and 400 MW offshore. In 2007, around 21 per cent of domestic power consumption was supplied by wind power, which makes Denmark the leading country in terms of wind power penetration (followed by Spain, where the share of wind as a total of electricity consumption is 12 per cent.
Figure 5.3 shows wind power’s average monthly coverage of power consumption in Denmark. Normally, the highest wind-generated production is from January to March. However, as 2006 was a bad wind year in Denmark, this was not the case. The contribution during the summer is normally at a fairly low level.
Figure 5.3: The Share of Wind Power in Power Consumption Calculated as Monthly Averages for 2006
Source: Risø DTU
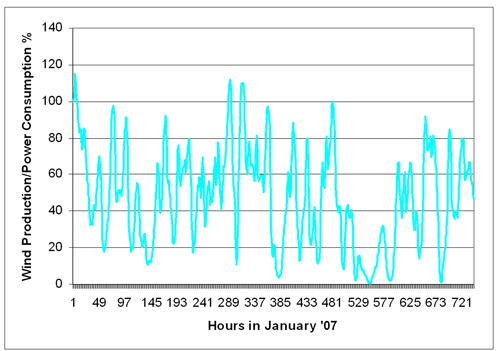
Considerable hourly variations are found in wind power production for Western Denmark, as illustrated in Figure 5.4. January 2007 was a tremendously good wind month, with an average supply of 44 per cent of power consumption in Western Denmark, and, as shown, wind-generated power exceeded power consumption on several occasions. Nevertheless, there were also periods with low and no wind in January. In such cases, wind power can significantly influence price determination on the power market. This will be discussed in more details in the following section.
Figure 5.4: Wind Power as a Percentage of Domestic Power Consumption in January 2007, Hourly Basis
Source: Risø DTU

HOW DOES WIND POWER INFLUENCE THE POWER PRICE AT THE SPOT MARKET?
Wind power is expected to influence prices on the power market in two ways:
- Wind power normally has a low marginal cost (zero fuel costs) and therefore enters near the bottom of the supply curve. This shifts the supply curve to the right (see Figure 5.5), resulting in a lower power price, depending on the price elasticity of the power demand. In general, the price of power is expected to be lower during periods with high wind than in periods with low wind.
- As mentioned above, there may be congestions in power transmission, especially during periods with high wind power generation. Thus, if the available transmission capacity cannot cope with the required power export, the supply area is separated from the rest of the power market and constitutes its own pricing area. With an excess supply of power in this area, conventional power plants have to reduce their production, since it is generally not possible to limit the power production of wind. In most cases, this will lead to a lower power price in this sub-market.
Figure 5.5: How Wind Power Influences the Power Spot Price at Different Times of the Day
Source: Risø DTU
The way in which wind power influences the power spot price due to its low marginal cost is shown in Figure 5.5. When wind power supply increases, it shifts the power supply curve to the right. At a given demand, this implies a lower spot price at the power market, as shown. However, the impact of wind power depends on the time of the day. If there is plenty of wind power at midday, during the peak power demand, most of the available generation will be used. This implies that we are at the steep part of the supply curve (see Figure 5.5) and, consequently, wind power will have a strong impact, reducing the spot power price significantly. But if there is plenty of wind-produced electricity during the night, when power demand is low and most power is produced on base load plants, we are at the flat part of the supply curve and consequently the impact of wind power on the spot price is low.
The congestion problem arises because Denmark, especially the Western region, has a very high share of wind power, and in cases of high wind power production, transmission lines are often fully utilised.
Figure 5.6: Left - Wind Power as Percentage of Power Consumption in Western Denmark; Right - Spot Prices for the Same Area and Time Period
Source: Risø DTU
In Figure 5.6, this congestion problem is illustrated for January 2007, when the share of wind-generated electricity in relation to total power consumption for West Denmark was more than 100 per cent at certain periods (Figure 5.6 left part). This means that during these periods, wind power supplied more than all the power consumed in that area. If the prioritised production from small, decentralised CHP plants is added on top of wind power production, there are several periods with a significant excess supply of power, part of which may be exported. However, when transmission lines are fully utilised, there is a congestion problem. In that case, equilibrium between demand and supply needs to be reached within the specific power area, requiring conventional producers to reduce their production, if possible. The consequences for the spot power price are shown on right graph of Figure 5.6. By comparing the two graphs in Figure 5.6, it is can be seen clearly that there is a close relationship between wind power in the system and changes in the spot price for this area.
The consequences of the two issues mentioned above for the West Denmark power supply area are discussed below. It should be mentioned that similar studies are available for Germany and Spain, which show almost identical results.


IMPACTS OF WIND POWER ON SPOT PRICES
The analysis entails the impacts of wind power on power spot prices being quantified using structural analyses. A reference is fixed, corresponding to a situation with zero contribution from wind power in the power system. A number of levels with increasing contributions from wind power are then identified and, relating to the reference, the effect of wind power’s power production is calculated. This is illustrated in the left-hand graph in Figure 5.7, where the shaded area between the two curves approximates the value of wind power in terms of lower spot power prices.
Figure 5.7: The Impact of Wind Power on the Spot Power Price in the West Denmark Power System in December 2005
Note: The calculation only shows how the production contribution from wind power influences power prices when the wind is blowing. The analysis cannot be used to answer the question 'What would the power price have been if wind power was not part of the energy system?'
Source: Risø DTU
In the right-hand graph in Figure 5.7, more detail is shown with figures from the West Denmark area. Five levels of wind power production and the corresponding power prices are depicted for each hour of the day during December 2005. The reference is given by the '0-150MW' curve, which thus approximates those hours of the month when the wind was not blowing. Therefore, this graph should approximate the prices for an average day in December 2005, in a situation with zero contribution from wind power. The other curves show increasing levels of wind power production: the 150-500MW curve shows a situation with low wind, increasing to storm in the >1,500MW curve. As shown, the higher the wind power production, the lower the spot power price is in this area. At very high levels of wind power production, the power price is reduced significantly during the day, but only falls slightly during the night. Thus there is a significant impact on the power price, which might increase in the long term if even larger shares of wind power are fed into the system.
Figure 5.7 relates to December 2005, but similar figures are found for most other periods during 2004 and 2005, especially in autumn and winter, owing to the high wind power production in these time periods.
Of course, ‘noise’ in the estimations does exist, implying ‘overlap’ between curves for the single categories of wind power. Thus, a high amount of wind power does not always imply a lower spot price than that with low wind power production, indicating that a significant statistical uncertainty exists. Of course, factors other than wind power production influence prices on the spot market. But the close correlation between wind power and spot prices is clearly verified by a regression analysis carried out using the West Denmark data for 2005, where a significant relationship is found between power prices, wind power production and power consumption.
When wind power reduces the spot power price, it has a significant influence on the price of power for consumers. When the spot price is lowered, this is beneficial to all power consumers, since the reduction in price applies to all electricity traded – not only to electricity generated by wind power.
Figure 5.8 shows the amount saved by power consumers in Western and Eastern Denmark due to wind power’s contribution to the system. Two calculations were performed: one using the lowest level of wind power generation as the reference (‘0-150MW’), in other words assuming that the power price would have followed this level if there was no contribution from wind power in the system, and the other more conservative, utilising a reference of above 500 MW. For each hour, the difference between this reference level and the levels with higher production of wind power is calculated. Summing the calculated amounts for all hours of the year gives the total benefit for power consumers of wind power lowering spot prices of electricity.
Figure 5.8 shows how much higher the consumer price would have been (excluding transmission tariffs, taxes and VAT) if wind power had not contributed to power production.
Figure 5.8: Annual Percentage and Absolute Savings by Power Consumers in Western and Eastern Denmark in 2004-2007 due to Wind Power Depressing the Spot Market Electricity Price
Source: Risø DTU
In general in 2004-2007, the cost of power to the consumer (excluding transmission and distribution tariffs, taxes and VAT) would have been approximately 4-12 per cent higher in Denmark if wind power had not contributed to power production. Wind power’s strongest impact is estimated to have been for Western Denmark, due to the high penetration of wind power in this area. In 2007, this adds up to approximately 0.5 c€/kWh saved by power consumers, as a result of wind power lowering electricity prices, compared to the support given to wind power as FITs of approximately 0.7 c€/kWh. Thus, although the expenses of wind power are still greater than the financial benefits for power consumers, a significant reduction of net expenses is certainly achieved due to lower spot prices.
Finally, though having a smaller impact, wind power clearly reduces power prices, even within the large Nordic power system. Thus although wind power in the Nordic countries is mainly established in Denmark, all Nordic power consumers benefit financially due to the presence of Danish wind power on the market.


| Acknowledgements | Sitemap | Partners | Disclaimer | Contact | ||
|
coordinated by |
supported by  |
The sole responsibility for the content of this webpage lies with the authors. It does not necessarily reflect the opinion of the European Communities. The European Commission is not responsible for any use that maybe made of the information contained therein. |
