MAIN PUBLICATION :
| Home � ECONOMICS � Offshore developments � The cost of energy generated by offshore wind power |

|
The Cost of Energy Generated by Offshore Wind Power
Although the costs are higher for offshore wind farms, they are somewhat offset by a higher total electricity production from the turbines, due to higher offshore wind speeds. For an on-land installation utilisation, the time is normally around 2,000-2,300 full load hours per year, while for a typical offshore installation this figure reaches more than 3,000 full load hours per year. The investment and production assumptions used to calculate the costs per kWh are stated in Table 2.9.
Table 2.9: Assumptions used for Economic Calculations.
In operation Capacity MW Million€/MW Full Load Hours per Year Middelgrunden 2001 40 1.2 2,500 Horns Rev I 2002 160 1.7 4,200 Samsø 2003 23 1.3 3,100 North Hoyle 2003 60 2.0 3,600 Nysted 2004 165 1.5 3,700 Scroby sands 2004 60 2.0 3,500 Kentich Flat 2005 90 1.8 3,100 Burbo 2007 90 2.0 3,550 Lillgrunden 2007 110 1.8 3,000 Robin Rigg 2008 180 2.7 3,600 Note: Robin Rigg is expected to be in operation in 2008
Source: Risø DTU
In addition, the following economic assumptions are made:
- Over the lifetime of the wind farm, annual O&M costs are assumed to be 16 €/MWh, except for Middelgrunden where these costs based on existing accounts are assumed to be 12 €/MWh for the entire lifetime
- The number of full load hours is given for a normal wind year and corrected for shadow effects in the farm, as well as unavailability and losses in transmission to the coast
- The balancing of the power production from the turbines is normally the responsibility of the farm owner. According to previous Danish experience, balancing requires an equivalent cost of around 3 €/MWh . However, balancing costs are also uncertain and may differ substantially between countries
- The economic analyses are carried out on a simple national economic basis, using a discount rate of 7.5 per cent per annum, over the assumed lifetime of 20 years. Taxes, depreciation, profit and risk premiums are not taken into account.
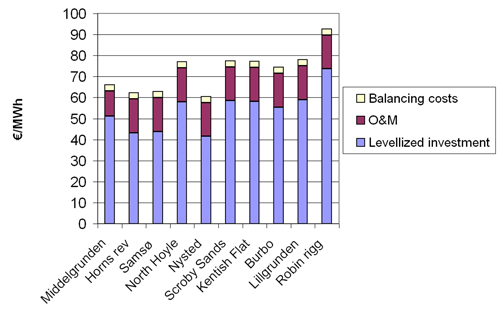
Figure 2.4 shows the total calculated costs per MWh for the wind farms listed in Table 2.10.
Figure 2.4: Calculated Production Cost for Selected Offshore Wind Farms, Including Balancing Costs (2006-prices).
Source: Risø DTU
It can be seen that total production costs differ significantly between the illustrated wind farms, with Horns Rev, Samsø and Nysted being among the cheapest, and Robin Rigg in the UK being the most expensive. Differences can be related partly to the depth of the sea and distance to the shore and partly to increased investment costs in recent years. O&M costs are assumed to be at the same level for all wind farms (except Middelgrunden) and are subject to considerable uncertainty.
Costs are calculated on a simple national economic basis, and are not those of a private investor. Private investors have higher financial costs and require a risk premium and profit. So the amount a private investor would add on top of the simple costs would depend, to a large extent, on the perceived technological and political risks of establishing the offshore farm and on the competition between manufacturers and developers.
| Acknowledgements | Sitemap | Partners | Disclaimer | Contact | ||
|
coordinated by  |
supported by  |
The sole responsibility for the content of this webpage lies with the authors. It does not necessarily reflect the opinion of the European Communities. The European Commission is not responsible for any use that maybe made of the information contained therein. |

