MAIN PUBLICATION :
| Home � Executive Summary � Part IV: Industry and Markets |

|
PART IV: INDUSTRY AND MARKETS
In 2001, the EU passed its directive on the promotion of electricity produced from renewable energy sources in the internal electricity market. This is still the most significant piece of legislation in the world for the integration of electricity produced by renewable energies, including wind power. This directive contains an indicative target of 21 per cent of final electricity demand in the EU to be covered by renewable energy sources by 2010, and regulates the electricity markets in which they operate. It has been tremendously successful in promoting renewables, particularly wind energy, and is the key factor explaining the global success of the European renewable energy industries and the global leadership position of European wind energy companies.
The gradual implementation of the 2001 renewable electricity directive in the Member States, as well as the unanimous decision made by the European Council at its Spring Summit in March 2007 for a binding 20 per cent share of renewable energy in the EU by 2020, are all steps in the right direction and indicators of increased political commitment. A new directive, based on a European Commission proposal from January 2008, was adopted by the European Parliament and Council in December 2008. It would raise the share of renewable energy in the EU from 8.5 per cent in 2005 to 20 per cent in 2020, which means that more than one-third of the EU’s electricity will have to come from renewables in 2020, up from 15 per cent in 2007. It is already clear that wind energy will be the largest contributor to this increase.
THE EU ENERGY MIX
While thermal generation, totalling over 430 GW, has long served as the backbone of Europe’s power production, combined with large hydro and nuclear, Europe is steadily transitioning away from conventional power sources towards renewable energy technologies (Chapter IV.1). Between 2000 and 2007, total EU power capacity increased by 200 GW, reaching 775 GW by the end of 2007. The most notable changes in the mix were the near doubling of gas capacity to 164 GW and wind energy more than quadrupling, from 13 to 57 GW.
WIND ENERGY IN THE EUROPEAN POWER MARKET
The EU is leading the way with policy measures to facilitate the move towards the deployment of renewable energy technologies. With an impressive compound annual growth rate of over 20 per cent in MW installed between 2000 and 2007 (Figure S.16), wind energy has clearly established itself as a relevant power source in Europe’s power generation market. 30 per cent of all power capacity installed in the EU over the five-year period has been wind power, making it the second largest contributor to installation of EU capacity over the last ten years, after natural gas (55 per cent). In 2007, 40 per cent of annual EU capacity installed was wind power, and wind power increased more than any other power-generating technology in Europe, including natural gas.
Figure S.16: New Power Capacity, EU, 2000–2007 (in MW)
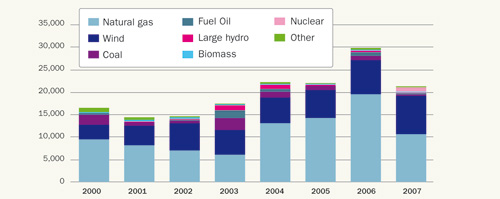
Sources: EWEA (2008); EWEA/Platts (2008)
Wind power’s share has jumped to over 10 per cent of total installed capacity and more than 5 per cent of national electricity demand in five European markets, Germany, Spain, Denmark, Portugal and Ireland, surpassing 10 per cent in both Spain and Denmark.
THE CURRENT STATUS OF THE EU WIND ENERGY MARKET
In the EU, installed wind power capacity has increased by an average of 25 per cent annually over the past 11 years, from 4,753 MW in 1997 to 56,535 MW in 2007 (Chapter IV.2). In terms of annual installations, the EU market for wind turbines has grown by 19 per cent annually, from 1,277 MW in 1997 to 8,554 MW in 2007. In 2007, Spain was by far the largest market for wind turbines, followed by Germany, France and Italy. Eight countries – Germany, Spain, Denmark, Italy, France, the UK, Portugal and The Netherlands – now have more than 1,000 MW installed. Germany, Spain and Denmark – the three pioneering countries of wind power – are home to 70 percent of installed wind power capacity in the EU (see Figures S.17 and S.18).
The more than 56,000 MW of total wind power capacity installed in the EU at the end of 2007 will produce 3.7 percent of the EU-27’s electricity demand in an average wind year.
With 1,080 MW by the end of 2007, offshore accounted for 1.9 per cent of installed EU capacity and 3.5 per cent of the electricity production from wind power in the EU. The market is still below its 2003 level and development has been slower than previously anticipated.
Figure S.17: 2007 Member State Market Shares for New Capacity (left)
Figure S.18: End 2007 Member State Market Shares for Total Capacity (right)
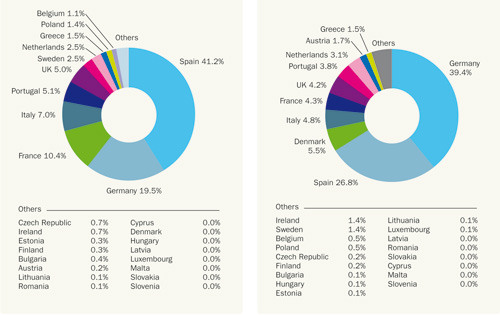
Source: EWEA (2008)
Table S.4: Cumulative Installations of Wind Power in the EU and Projections for 2010 (in MW)
| CUMULATIVE INSTALLATIONS | |||||||||
| Country | 2000 | 2001 | 2002 | 2003 | 2004 | 2005 | 2006 | 2007 | 2010 |
|
Austria |
77 | 94 | 140 | 415 | 606 | 819 | 965 | 982 | 1,200 |
| Belgium | 13 | 32 | 35 | 68 | 96 | 167 | 194 | 287 | 800 |
| Bulgaria | 10 | 10 | 36 | 70 | 200 | ||||
| Cyprus | 0 | 0 | 0 | 0 | 0 | 0 | 0 | ||
| Czech Republic | 3 | 9 | 17 | 28 | 54 | 116 | 250 | ||
| Denmark | 2,417 | 2,489 | 2,889 | 3,116 | 3,118 | 3,128 | 3,136 | 3,125 | 4,150 |
| Estonia | 2 | 2 | 6 | 32 | 32 | 58 | 150 | ||
| Finland | 39 | 39 | 43 | 52 | 82 | 82 | 86 | 110 | 220 |
| France | 66 | 93 | 148 | 257 | 390 | 757 | 1,567 | 2,454 | 5,300 |
| Germany | 6,113 | 8,754 | 11,994 | 14,609 | 16,629 | 18,415 | 20,622 | 22,247 | 25,624 |
| Greece | 189 | 272 | 297 | 383 | 473 | 573 | 746 | 871 | 1,500 |
| Hungary | 3 | 3 | 3 | 17 | 61 | 65 | 150 | ||
| Ireland | 118 | 124 | 137 | 190 | 339 | 496 | 746 | 805 | 1,326 |
| Italy | 427 | 682 | 788 | 905 | 1,266 | 1,718 | 2,123 | 2,726 | 4,500 |
| Latvia | 24 | 27 | 27 | 27 | 27 | 27 | 100 | ||
| Lithuania | 0 | 0 | 6 | 6 | 48 | 50 | 100 | ||
| Luxembourg | 10 | 15 | 17 | 22 | 35 | 35 | 35 | 35 | 50 |
| Malta | 0 | 0 | 0 | 0 | 0 | 0 | 0 | ||
| Netherlands | 446 | 486 | 693 | 910 | 1,079 | 1,219 | 1,558 | 1,746 | 3,000 |
| Poland | 27 | 63 | 63 | 83 | 153 | 276 | 1,000 | ||
| Portugal | 100 | 131 | 195 | 296 | 522 | 1,022 | 1,716 | 2,150 | 3,500 |
| Romania | 1 | 1 | 1 | 2 | 3 | 8 | 50 | ||
| Slovakia | 0 | 3 | 5 | 5 | 5 | 5 | 25 | ||
| Slovenia | 0 | 0 | 0 | 0 | 0 | 0 | 25 | ||
| Spain | 2,235 | 3,337 | 4,825 | 6,203 | 8,264 | 10,028 | 11,623 | 15,145 | 20,000 |
| Sweden | 231 | 293 | 345 | 399 | 442 | 510 | 571 | 788 | 1,665 |
| UK | 406 | 474 | 552 | 667 | 904 | 1,332 | 1,962 | 2,389 | 5,115 |
| EU Accumulated* | 12,887 | 17,315 | 23,098 | 28,491 | 34,372 | 40,500 | 48,031 | 56,535 | 80,000 |
Note: *From 2004EU-25; from 2007 EU-27.
Source: EWEA (2008)
EUROPEAN WIND INDUSTRY: PLAYERS AND INVESTMENT TRENDS
Wind’s spectacular growth as a vehicle for new generation capacity investment has attracted a broad range of players across the industry value chain (Chapter IV.3). From local, site-focused engineering firms to global vertically integrated utilities, all have formed part of wind energy’s European growth story.
As the region responsible for pioneering widespread, larger-scale take-up of wind power, Europe hosts the tightest competition for market share, among roughly a dozen suppliers. The European market has seen a highly stable market share distribution, with few major shifts since a round of consolidation among leading suppliers during 2003 and 2004. Between 2004 and 2007, three players averaged over a 15 per cent market share of annual MW added each, followed by four players with a 5–10 per cent share.
Supply chain management represents a key competitive driver in wind turbine supply. The relationships between turbine manufacturers and their component suppliers have become increasingly crucial, and have come under increasing stress in the past three years, as soaring demand has required faster ramp-up times, larger investments and greater agility to capture value in a rapidly growing sector.
Furthermore, Europe’s wind energy value chain is seeing dynamic shifts, as asset ownership is redistributed, growth is sought in maturing markets and players seek to maximise scale on an increasingly pan-European stage. The proliferation of players looking to develop, own or operate wind plants has pushed competition to a new level, underlining the key elements of local market knowledge, technical expertise and financial capacity as crucial to positioning on the value chain.
KEY PLAYER POSITIONING
Europe’s shifting distribution of wind power asset ownership clearly illustrates the industry’s scaling up and geographic expansion. From an industry concentrated in Denmark and Germany with single, farmer-owned turbines at the end of the 1990s, wind power ownership now includes dozens of multinational players, owning several GWs of installed capacity. Five main blocks of ownership now characterise the structure of the European market:
- utilities;
- Europe’s largest Independent Power Producers (IPP);
- other Spanish IPPs;
- German investors;
- other European investors/IPPs.
Over the past five years, the most salient trend has been the increased participation of utilities in the industry. Utility share of total wind power installed increased from 17 per cent in 2002 to 25 per cent in 2007. The biggest jump took place between 2005 and 2006, as the region’s top wind utilities saw annual additions of well over 500 MW.
PLANNED FUTURE INVESTMENT
For the 2007 to 2010 time frame, Europe’s top 15 utilities and IPPs in terms of MW owned declared construction pipelines totalling over 18 GW, which translates into well over €25 billion in wind plant investment, based on current cost estimates per MW installed. Overall, the European wind market is expected to grow at a rate of over 9 GW installed annually through to 2010, which translates into annual investments pushing past €10 billion to nearly €16 billion.
The overall European wind power market environment is coming of age with the technology’s steady emergence into the overall power market. Although wind has become an integral part of the generation mix, alongside conventional power sources, of markets such as Germany, Spain and Denmark, it continues to face the double challenge of competing against other renewable technologies while proving to be a strong energy choice for large power producers seeking to grow and diversify their portfolios.
Source: Neoenergia
THE STATUS OF THE GLOBAL WIND ENERGY MARKETS
In its best year yet, the global wind industry, discussed in Chapter IV.4, installed 20,000 MW in 2007. This development was lead by the US, China and Spain, and it brought the worldwide installed capacity to 94,122 MW. This was an increase of 31 per cent compared with the 2006 market, and represented an overall increase in global installed capacity of about 27 per cent.
The top five countries in terms of installed capacity are Germany (22.3 GW), the US (16.8 GW), Spain (15.1 GW), India (7.8 GW) and China (5.9GW). In terms of economic value, the global wind market in 2007 was worth about€25 billion (US $37 billion) in new generating equipment, and attracted €34 billion (US$50.2 billion) in total investment.
Europe remains the leading market for wind energy – its new installations represented 43 per cent of the global total and European companies supplied 66 per cent of the world’s wind power capacity in 2007.
US AND CHINESE MARKETS CONTINUE TO BOOM
The US reported a record 5,244 MW installed in 2007, more than double the 2006 figure, accounting for about 30 per cent of the country’s new power-producing capacity in 2007. Overall US wind power generating capacity grew by 45 per cent in 2007, with total installed capacity now standing at 16.8 GW. While wind energy in the EU covered some 4 per cent of 2008 electricity demand, however, US wind farms will generate around 48 billion kWh of electricity in 2008, representing just over 1 per cent of US electricity supply.
China added 3,449 MW of wind energy capacity during 2007, representing market growth of 156 per cent over 2006, and now ranks fifth in total installed wind energy capacity, with over 6,000 MW at the end of 2007. However, experts estimate that this is just the beginning, and that the real growth in China is still to come. European manufacturers are well positioned to exploit this market opportunity.
ADMINISTRATIVE AND GRID ACCESS BARRIERS
Today, integration of electricity from renewable energy sources into the European electricity market faces multiple barriers. Chapter IV.5 takes a developer’s point of view and observes the barriers occurring during the process of acquiring building permits, spatial planning licences and grid access, using the example of four EU Member States.
Barriers are encountered if the procedures with which a project developer has to comply are not set out in a coherent manner; these include a lack of transparency and excessive administrative requirements. Every European Member State faces such barriers, but their impact on the deployment of renewable energy differs for each country. Barriers at the administrative, social and financial levels, as well as in relation to grid connection, are a serious obstacle to investment and the competitiveness of wind energy in the European and global markets.
| Acknowledgements | Sitemap | Partners | Disclaimer | Contact | ||
|
coordinated by |
supported by  |
The sole responsibility for the content of this webpage lies with the authors. It does not necessarily reflect the opinion of the European Communities. The European Commission is not responsible for any use that maybe made of the information contained therein. |
