MAIN PUBLICATION :
| Home � Executive Summary � Part VI: Scenarios and Targets |

|
PART VI: SCENARIOS AND TARGETS
The European Commission’s 1997 white paper on renewable sources of energy set the goal of doubling the share of renewable energy in the EU’s energy mix from 6 per cent to 12 per cent by 2010. It included a target of 40,000 MW of wind power in the EU by 2010, producing 80 TWh of electricity and saving 72 million tonnes (Mt) of CO2 emissions per year. The 40,000 MW target was reached in 2005.
The 40,000 MW goal from the European Commission’s white paper formed EWEA’s target in 1997, but three years later, due to the strong developments in the German, Spanish and Danish markets for wind turbines, EWEA increased its target by 50 per cent, to 60,000 MW by 2010 and 150,000 MW by 2020 (Chapters VI.1 and VI.2). In 2003, EWEA once again increased its target, this time by 25 per cent to 75,000 MW by 2010 and 180,000 MW by 2020. Due to the expansion of the EU with 12 new Member States, EWEA increased its reference scenario for 2010 to 80,000 MW, while maintaining its 2020 target of 180,000 MW and setting a target of 300,000 MW by 2030 (Figure S.19).
Figure S.19: EWEA’s Three Wind Power Scenarios (in GW)
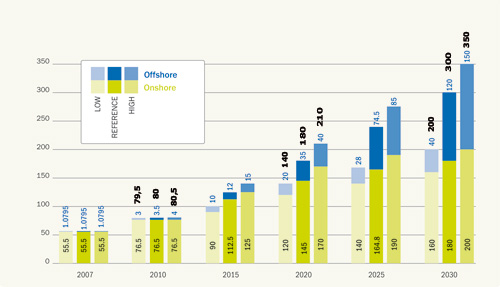
Source: EWEA (2008)
If the reference scenario is reached, wind power production will increase to 177 TWh in 2010, 477 TWh in 2020 and 935 TWh in 2030 (Chapter VI.3). The European Commission’s baseline scenario assumes an increase in electricity demand of 33 per cent between 2005 and 2030 (4,408 TWh). Assuming that EU electricity demand develops as projected by the European Commission, wind power’s share of EU electricity consumption will reach 5 per cent in 2010, 11.7 per cent in 2020 and 21.2 per cent in 2030.
If political ambitions to increase energy efficiency are fulfilled, moreover, wind power’s share of future electricity demand will be greater than the baseline scenario. In 2006, the European Commission released new scenarios to 2030 on energy efficiency and renewables. If EU electricity demand develops as projected in the European Commission’s ‘combined high renewables and efficiency’ (RE&Eff) case, wind energy’s share of electricity demand will reach 5.2 per cent in 2010, 14.3 percent in 2020 and 28.2 per cent in 2030 (see Table S.6).
Table S.6: Wind Power’s Share of EU Electricity Demand
| 2000 | 2007 | 2010 | 2020 | 2030 | |
| Wind power production (TWh) | 23 | 119 | 177 | 477 | 935 |
| Reference electricity demand (TWh) * | 2577 | 3243 | 3568 | 4078 | 4408 |
| RE&Eff case electricity demand (TWh)* | 2577 | 3243 | 3383 | 3345 | 3322 |
| Wind energy share (reference) | 0.9 | 3.7 | 5.0 | 11.7 | 21.2 |
| Wind energy share (RE&Eff case) | 0.9 | 3.7 | 5.2 | 14.3 | 28.2 |
*Sources: Eurelectric, EWEA and European Commission
Since 1996, the European Commission has changed its baseline scenario five times. Over the 12-year period, targets for wind energy in 2010 and 2020 have been increased almost tenfold, from 8000 MW to 71,000 MW (2010)and from 12,000 MW to 120,000 MW (2020) in the European Commission’s latest baseline scenario from 2008.
Somewhat surprisingly, the baseline scenario from 2008 gives significantly lower figures for wind energy than the baseline scenario from 2006. The 71,000 MW projection for 2010 implies that the wind energy market in Europe will decrease by approximately 50 per cent over the next three years with respect to the present market. In light of the current market achievements, growth trends and independent market analyses, the European Commission’s baseline scenario seems out of touch with current reality and clearly underestimates the sector’s prospects in the longer term.
Both the European Commission and IEA’s baseline scenarios for wind energy assume that market growth will slow significantly – the European Commission by as much as 50 per cent (compared to the EWEA scenario), to reach its 71 GW target for 2010. Their advanced scenarios, however, are in line with EWEA’s target for 2010, while the European Commission’s 2006 scenario even exceeds EWEA’s 180 GW target for 2020.
Turbine prices have increased since 2005; however, one of the significant advantages of wind power is that the fuel is free. Therefore the total cost of producing wind energy throughout the 20- to 25-year lifetime of a wind turbine can be predicted with great accuracy. Neither the future prices of coal, oil or gas nor the price of carbon will affect the cost of wind power production. This, as Chapter VI.4 points out, is probably wind energy’s most significant competitive advantage in the global energy market.
Cumulative investments in wind energy over the three decades from 2000 to 2030 will total €390 billion. According to EWEA’s reference scenario, approximately €340 billion will be invested in wind energy in the EU-27 between 2008 and 2030.
As can be seen from Table S.7, changing the CO2 and the fuel price assumptions has a dramatic impact on the resulting fuel and CO2 costs that are avoided by installing wind energy capacity. With low CO2 prices (€10/t) and fuel prices (equivalent of $50/barrel of oil) throughout the period, the wind power investments over the next 23 years avoid €466 billion instead of €783 billion in fuel and CO2 costs. With high prices for CO2 (€40/t) and fuel (equivalent to $120/barrel of oil), wind power would avoid fuel and CO2 costs equal to more than €1 trillion over the three decades from 2000 to 2030.
Table S.7 shows the different savings made depending on the price of oil (per barrel) and CO2 (per tonne):
Table S.7: Savings (in billions of €) Made Depending on the Price of Fuel and CO2 (per tonne)
| Totals (Fuel prices equivalent to oil at $90; CO2 €25) | 2008–2010 | 2011–2020 | 2021–2030 | 2008–2020 | 2008–2030 |
| Investment | 31.062 | 120.529 | 187.308 | 151.591 | 338.899 |
| Avoided CO2 cost | 21.014 | 113.890 | 186.882 | 134.904 | 321.786 |
| Avoided fuel cost | 51.165 | 277.296 | 455.017 | 328.462 | 783.479 |
| Totals (Fuel prices equivalent to oil at $50; CO2 €10) | 2008–2010 | 2011–2020 | 2021–2030 | 2008–2020 | 2008–2030 |
| Investment | 31.062 | 120.529 | 187.308 | 151.591 | 338.899 |
| Avoided CO2 cost | 8.406 | 45.556 | 74.753 | 53.962 | 128.714 |
| Avoided fuel cost | 30.456 | 165.057 | 270.843 | 195.513 | 466.356 |
| Totals (Fuel prices equivalent to oil at $120; CO2 €40) | 2008–2010 | 2011–2020 | 2021–2030 | 2008–2020 | 2008–2030 |
| Investment | 31.062 | 120.529 | 187.308 | 151.591 | 338.899 |
| Avoided CO2 cost | 33.623 | 182.223 | 299.011 | 215.846 | 514.857 |
| Avoided fuel cost | 67.002 | 363.126 | 595.856 | 430.128 | 1.025.984 |
Source: EWEA (2008)
The Global Wind Energy Council (GWEC) predicts that the global market for wind turbines will grow by over 155 per cent from 94 GW in 2007 to reach 240.3 GW of total installed capacity by 2012 (Chapter VI.5). In particular, the US and Chinese markets are expected to expand dramatically.
Depending on the increase in demand, wind power could cover 11.5 to 12.7 per cent of global electricity consumption in 2020, according to GWEC, and as much as 20.2 to 24.9 per cent – in other words between a fifth and a quarter of the world’s electricity needs – in 2030 (Chapter VI.6).
| Acknowledgements | Sitemap | Partners | Disclaimer | Contact | ||
|
coordinated by |
supported by  |
The sole responsibility for the content of this webpage lies with the authors. It does not necessarily reflect the opinion of the European Communities. The European Commission is not responsible for any use that maybe made of the information contained therein. |
